I’m a stats geek and love analyzing the Sacramento Real Estate Market numbers, so… Every Tuesday I provide a quick snapshot of what’s going on with the market in Sacramento. Call, email, text or leave a comment below if you have any questions or opinions…
ACTIVE INVENTORY IN SACRAMENTO
2,912
Available Homes on the Sacramento Real Estate Market
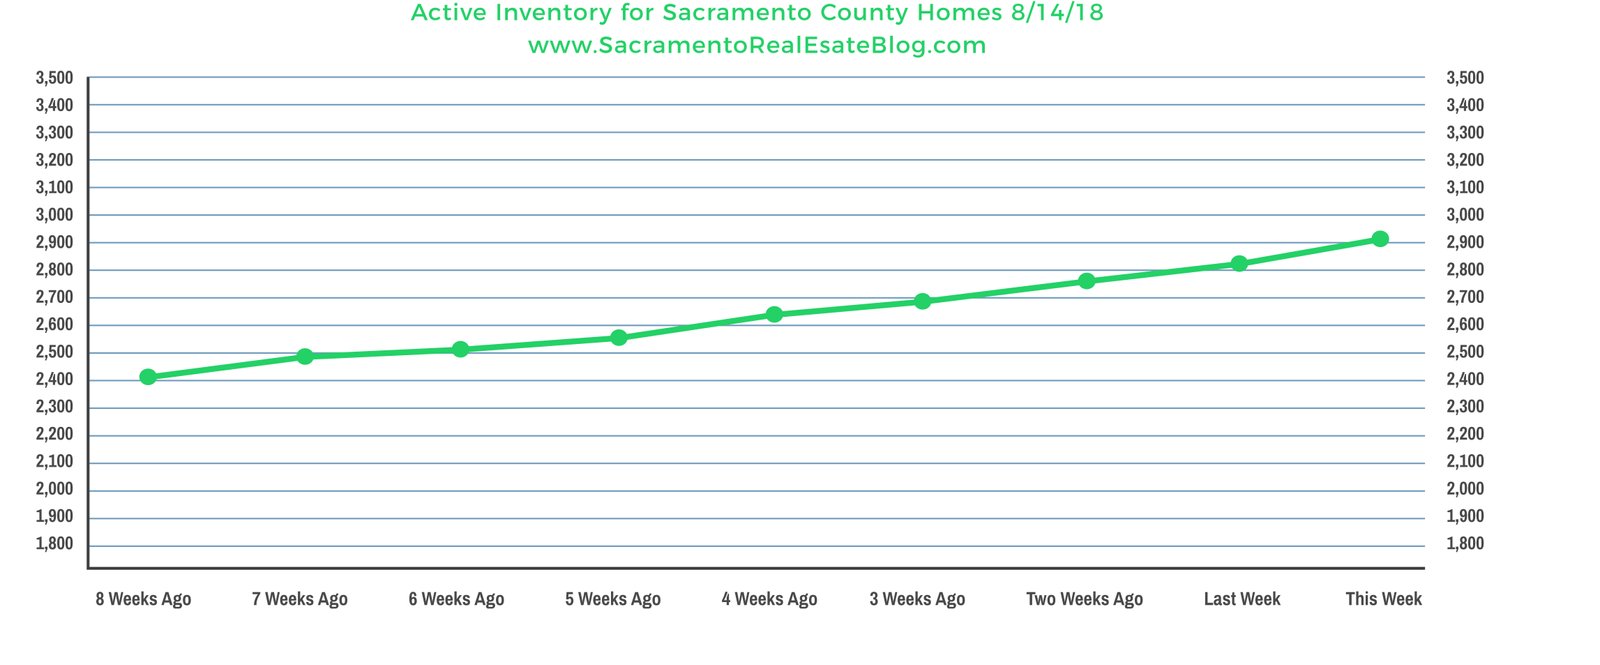
2,823 LAST WEEK
2,770 TWO WEEKS AGO
2,699 THREE WEEKS AGO
2,656 FOUR WEEKS AGO
2,564 FIVE WEEKS AGO
2,514 SIX WEEKS AGO
2,490 SEVEN WEEKS AGO
2,413 EIGHT WEEKS AGO
PENDING INVENTORY IN SACRAMENTO
2,031
Pending Homes on the Sacramento Real Estate Market
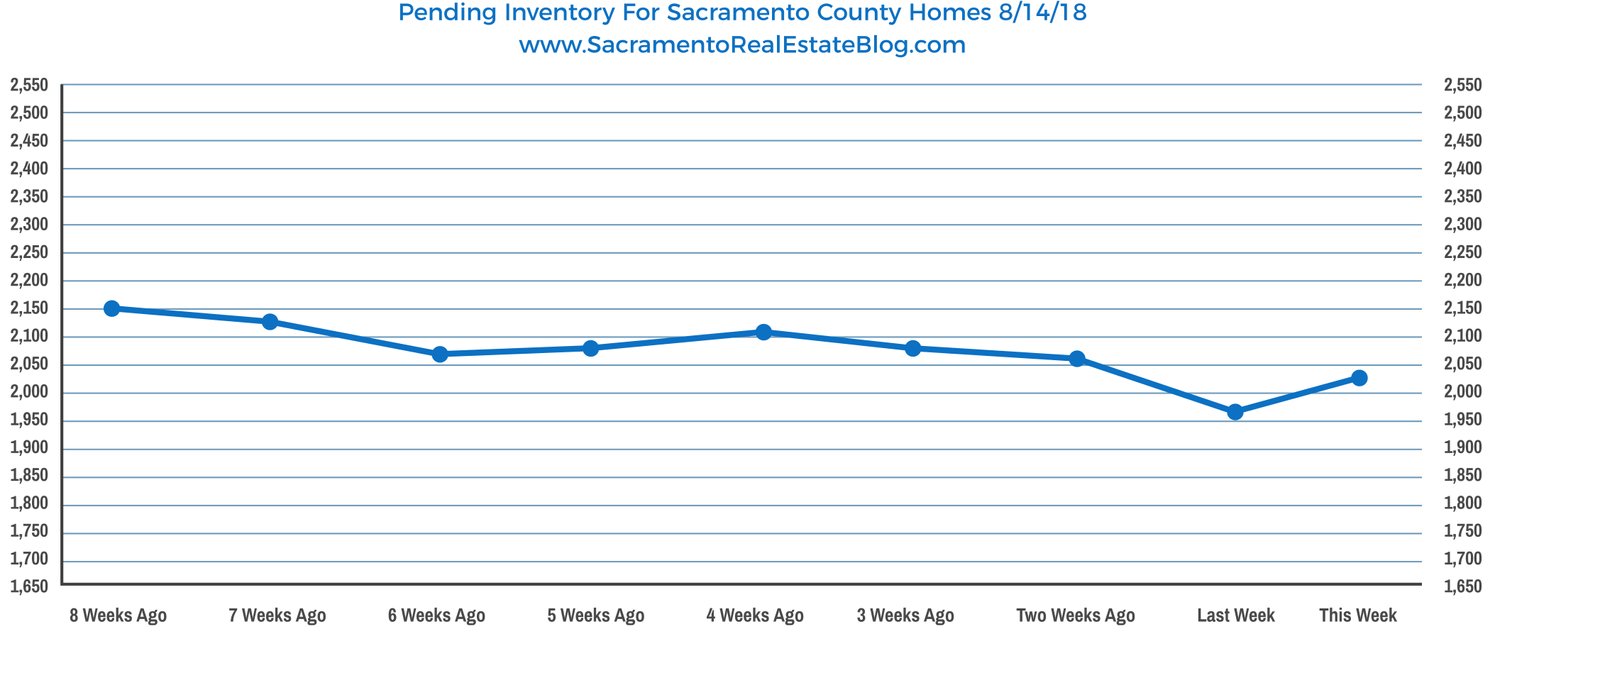
1,966 LAST WEEK
2,066TWO WEEKS AGO
2,080 THREE WEEKS AGO
2,110 FOUR WEEKS AGO
2,085 FIVE WEEKS AGO
2,065 SIX WEEKS AGO
2,138 SEVEN WEEKS AGO
2,150 EIGHT WEEKS AGO
MEDIAN PRICE OF SACRAMENTO HOMES SOLD FOR THE MONTH
$374,500
Median Selling Price So Far This Month

AUGUST 2018: SO FAR THIS MONTH – $374,500
JULY 2018 – $370,000
JUNE 2018 – $375,000
MAY 2018 – $375,000
APRIL 2018 – $372,000
MARCH 2018 – $365,000
FEBRUARY 2018 – $350,000
JANUARY 2018 – $350,000
DECEMBER 2017 – $349,950
NOVEMBER 2017 – $349,900
OCTOBER 2017- $347,500
SEPTEMBER 2017- $348,000
AUGUST 20117- $349,000
JULY 2017- $355,000
JUNE 2017- $347,250
MAY 2017 – $345,000
APRIL 2017 – $329,500
MARCH 2017 – $328,000
FEBRUARY 2017 – $325,000
JANUARY 2017 – $305,000
DECEMBER 2016: – $315,000
NOVEMBER 2016 – $325,000
OCTOBER 2016 – $321,000
SEPTEMBER 2016 – $318,500
AUGUST 2016 – $324,000
JULY 2016 – $322,000
JUNE 2016 – $329,000
CLOSING SACRAMENTO HOMES FOR THE MONTH
510
Homes Sold So Far This Month
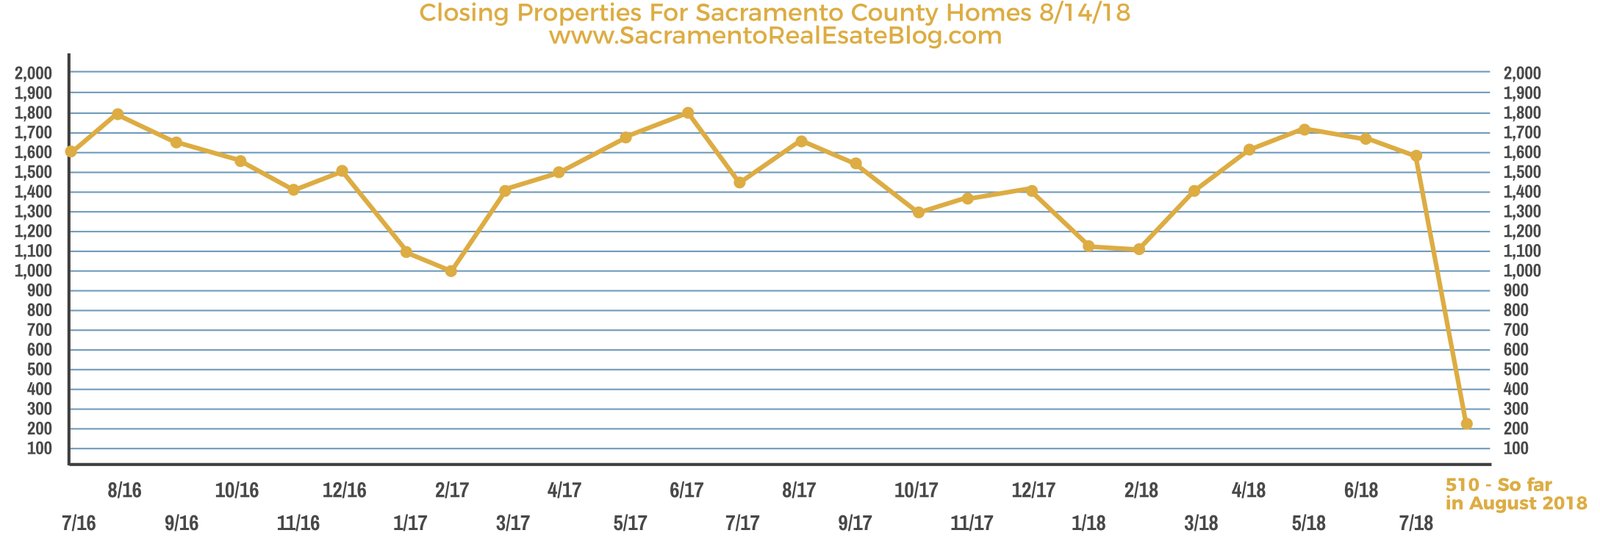
August 2018: SO FAR THIS MONTH – 510 HOMES SOLD
JULY 2018- 1,593
JUNE 2018 – 1,688
MAY 2018 – 1,712
APRIL 2018 – 1,617
MARCH 2018 – 1,416
FEBRUARY 2018 – 1,115
JANUARY 2018 – 1,129
DECEMBER 2017 – 1,408
NOVEMEBER 2017 – 1,396
JUNE 2018 – 1,688
MAY 2018 – 1,712
APRIL 2018 – 1,617
MARCH 2018 – 1,416
FEBRUARY 2018 – 1,115
JANUARY 2018 – 1,129
DECEMBER 2017 – 1,408
NOVEMEBER 2017 – 1,396
OCTOBER 2017 – 1,300
SEPTEMBER 2017 – 1,554
AUGUST 2017 – 1,681
JULY 2017 – 1,478
JUNE 2017 – 1,824
MAY 2017 – 1,691
APRIL 2017 – 1,512
MARCH 2017 – 1,407
FEBRUARY 2017 – 1,004
JANUARY 2017 – 1,101
DECEMBER 2016 – 1,530
NOVEMBER 2016 – 1,434
OCTOBER 2016 – 1,584
SEPTEMBER 2016 – 1,647
AUGUST 2016 – 1,799
JULY 2016 – 1,622