
ACTIVE INVENTORY IN SACRAMENTO
1,117
Available Homes on the Sacramento Real Estate Market
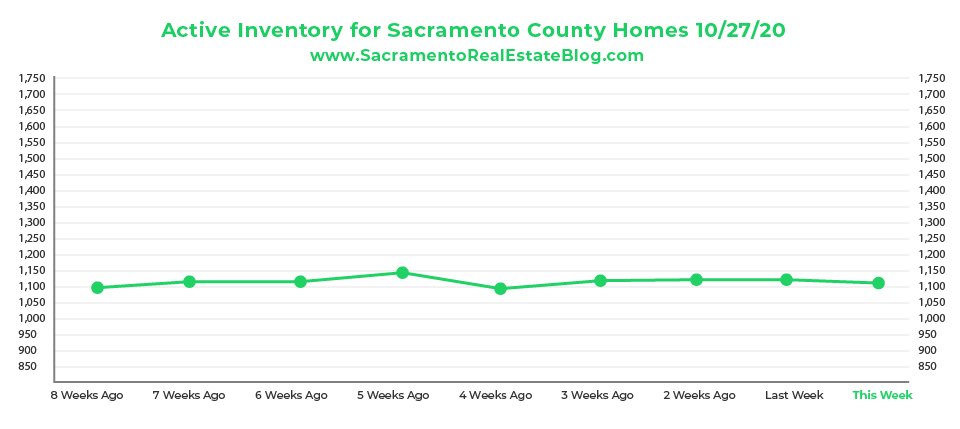
Available Homes
1,117 – THIS WEEK
1,133 – LAST WEEK
1,123 – TWO WEEKS AGO
1,119 – THREE WEEKS AGO
1,095 – FOUR WEEKS AGO
1,146 – FIVE WEEKS AGO
1,117 – SIX WEEKS AGO
1,116 – SEVEN WEEKS AGO
1,097 – EIGHT WEEKS AGO
PENDING INVENTORY IN SACRAMENTO
2,279
Pending Homes on the Sacramento Real Estate Market
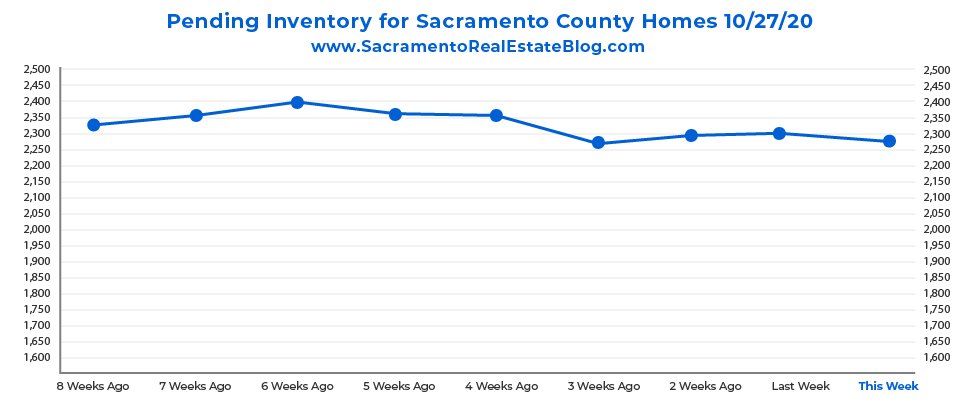
Pending Homes
2,279 – THIS WEEK
2,303 – LAST WEEK
2,294 – TWO WEEKS AGO
2,274 – THREE WEEKS AGO
2,355 – FOUR WEEKS AGO
2,361 – FIVE WEEKS AGO
2,393 – SIX WEEKS AGO
2,359 – SEVEN WEEKS AGO
2,337 – EIGHT WEEKS AGO
MEDIAN PRICE OF SACRAMENTO HOMES SOLD THIS MONTH
$441,500
Median Selling Price So Far This Month
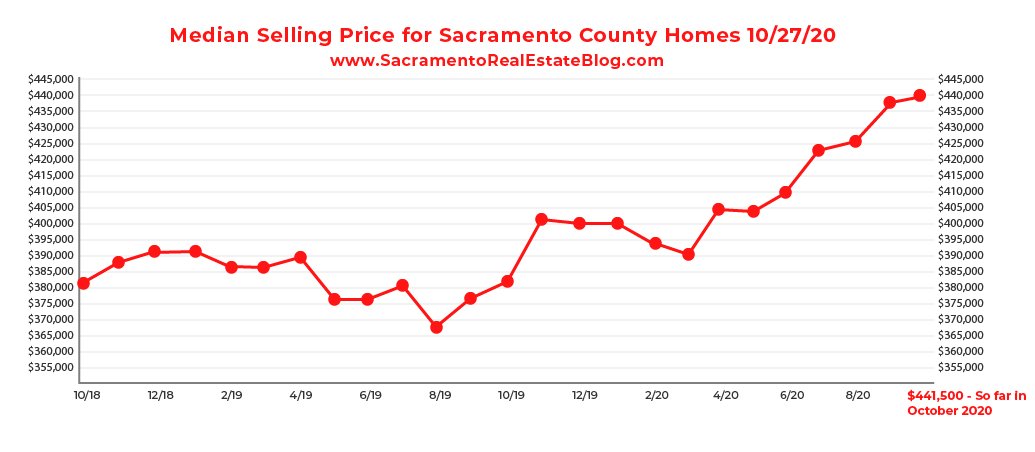
Price ($)
$441,500 – So Far In October 2020
$438,500 – September 2020
$425,000 – August 2020
$422,500 – July 2020
$405,000 – June 2020
$397,378 – May-2020
$400,000 – April-2020
$400,000 – March-2020
$400,000 – February-2020
$376,000 – January-2020
$385,000 – December-2019
$385,652 – November-2019
$385,000 – October-2019
$388,000 – September-2019
$385,000 – August-2019
$391,000 – July-2019
$390,000 – June-2019
$384,000 – May-2019
$385,000 – April-2019
$365,750 – March-2019
$360,000 – February-2019
$351,000 – January-2019
$364,500 – December-2018
$360,000 – November-2018
$360,000 – October-2018
$373,700 – September-2018
$370,000 – August-2018
CLOSINGS THIS MONTH IN SACRAMENTO
1,320
Homes Sold So Far This Month
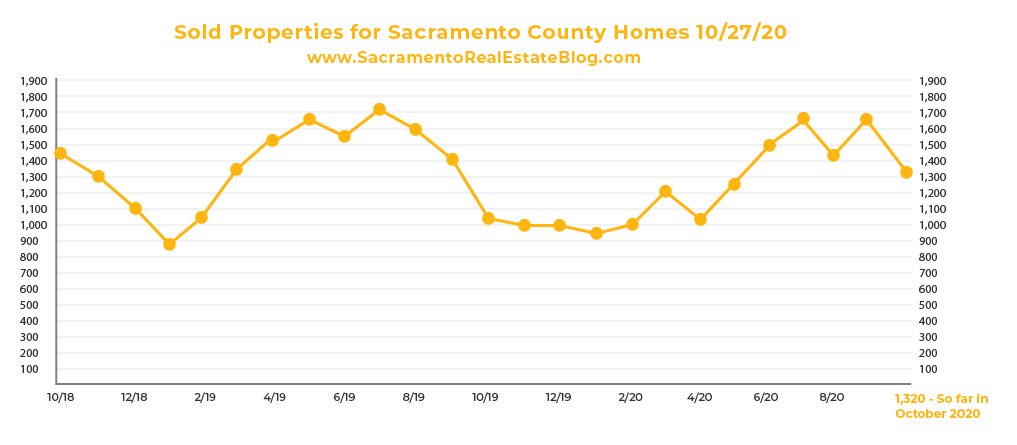
Homes Sold
1,320 – Homes Sold So Far In October 2020
1,670 – September 2020
1,433 – August 2020
1,681 – July 2020
1,502 – June 2020
1,246- May-2020
1,022 – April-2020
1,064 – March-2020
1,023 – February-2020
1,008 – January-2020
1,098 – December-2019
1,238 – November-2019
1,225 – October-2019
1,416 – September-2019
1,663 – August-2019
1,726 – July-2019
1,577 – June-2019
1,671 – May-2019
1,556 – April-2019
1,345 – March-2019
992 – February-2019
894 – January-2019
1,104 – December-2018
1,304 – November-2018
1,461 – October-2018
1,363 – September-2018
1,720 – August-2018